

Most enterprise transformation programs don’t fail because of bad technology choices. They failed because nobody was watching the right numbers.
Walk into any large organisation midway through a digital transformation, and you’ll find dashboards everywhere. Velocity charts. Sprint burn-downs. Code coverage percentages. All meticulously tracked, all presented in weekly status meetings. And yet, six months later, the program is three months behind, the budget has ballooned by 40%, and nobody can clearly explain what’s actually been delivered to the business.
The problem isn’t a lack of metrics. It’s that we’re measuring the wrong things.
Why Traditional Metrics Miss the Mark in Enterprise Settings
In startups and product companies, engineering metrics evolved in relatively controlled environments. Small teams, clear ownership, direct access to users, and the ability to pivot quickly. The metrics that work there are story points completed, deployment frequency, code commit rates were designed for that context.
Enterprise programs operate in a different world entirely. You’re coordinating across multiple vendors, navigating complex approval chains, integrating with decades-old legacy systems, and managing stakeholders who speak entirely different languages. A metric that tells you developers are committing code daily says nothing about whether that code will actually make it through your change control board, pass your security audit, or survive integration with the mainframe system that runs your core operations.
The gap between engineering activity and business outcome becomes enormous at enterprise scale. And most engineering metrics measure activity, not outcome.
What Actually Goes Wrong
Before we talk about what to measure, let’s be honest about what typically derails large enterprise programs.
Scope creep happens silently. Not through dramatic change requests, but through a thousand small additions. “While we’re rebuilding the customer portal, can we also add this small feature the sales team mentioned?” Each addition seems reasonable in isolation. Collectively, they double your timeline.
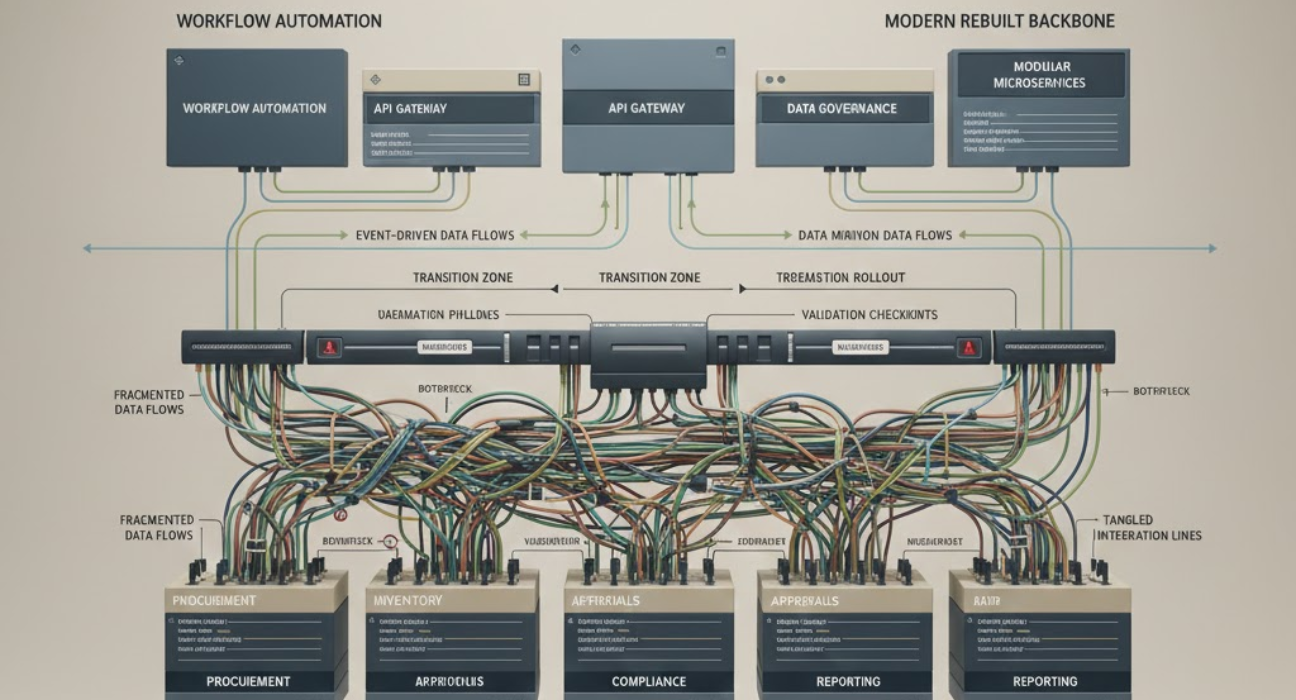
Integration complexity gets discovered late. Your vendor demonstrates a beautiful new system in their sandbox environment. Then you try to connect it to your existing ERP, CRM, data warehouse, and authentication systems. Suddenly you’re in month four of integration work that was originally scoped as two weeks.
Knowledge sits in silos. The vendor team knows how their system works. Your internal IT team knows your infrastructure. Your business teams know the actual workflows. These groups rarely share a common language or complete picture. Critical assumptions go unvalidated until far too late.
Technical debt accumulates invisibly. Teams take shortcuts to meet deadlines. “We’ll refactor this later.” Later never comes. Six months after go-live, the system is already difficult to maintain, and the team that built it has moved on.
Risk surfaces only when it becomes a crisis. You discover your cloud architecture won’t pass the security audit three weeks before planned production deployment. Or that your data migration approach won’t scale to production volumes. Or that your disaster recovery plan doesn’t actually work.
These aren’t hypothetical scenarios. This is what happens in enterprise programs every single day.
The Metrics That Tell You What’s Really Happening
So what should you actually be tracking? Here are the metrics that matter when you’re running complex, multi-year enterprise programs.
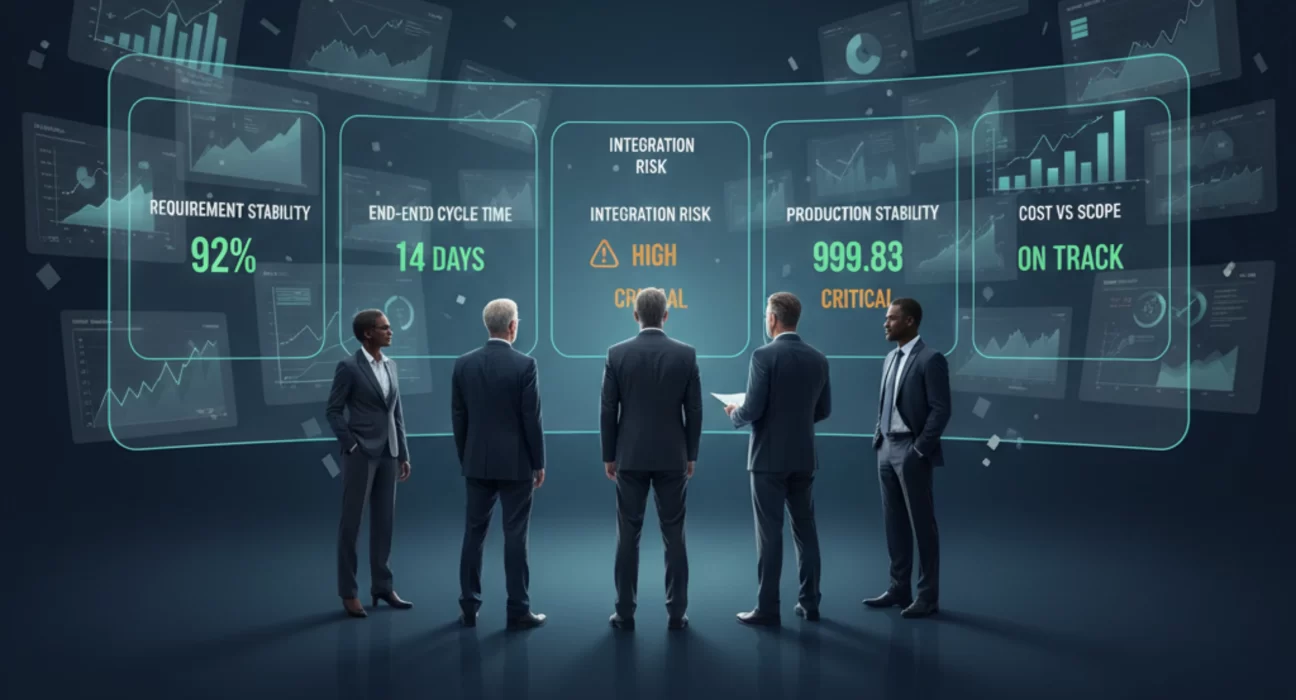
Requirement Stability Rate
Track what percentage of your original requirements remain unchanged month over month. Not just the big features, but the detailed acceptance criteria and integration points.
If this number is constantly shifting especially after development has started you have a fundamental problem. Either the business doesn’t actually know what it needs, or your requirements process isn’t working. No amount of agile methodology will save you if the target keeps moving.
Good enterprise programs show requirement stability above 85% once you’re past initial discovery. If you’re below 70%, stop and fix your requirements process before writing more code.
End-to-End Cycle Time
Measure how long it takes for a change to go from concept to production. Not just development time the entire journey. Through design approvals, security reviews, testing cycles, change control boards, deployment windows.
In many enterprises, this number is shockingly high. Thirty days of development followed by ninety days of waiting for approvals and deployment slots. This metric exposes your organizational bottlenecks far more effectively than any development velocity chart.
If your cycle time is measured in months, you need to fix your governance processes, not hire more developers.
Integration Defect Density
Count the defects that appear specifically at integration points where your new system connects to existing ones. Track this separately from functional defects within the new system itself.
High integration defect density almost always means your technical discovery was incomplete. You didn’t truly understand the systems you’re integrating with. This is especially common when working with legacy systems where documentation is poor and tribal knowledge has walked out the door.
Smart enterprise delivery partners, like Ozrit, invest heavily in integration discovery before committing to timelines. They know that integration complexity is where enterprise programs live or die.
Production Incident Rate (Post Go-Live)
Most programs track defects during development and testing. Fewer track what happens after go-live with the same rigor.
Count every production incident in the first 90 days after deployment. Classify them by severity and root cause. If you’re seeing more than two critical incidents per month, something fundamental is wrong with your testing approach or your production readiness assessment.
This metric also tells you whether you’re truly ready for go-live or just meeting an arbitrary deadline. Pushing a system to production when this number is high is expensive. Very expensive.
Vendor Dependency Resolution Time
When you’re blocked waiting for a vendor for a bug fix, a configuration change, an answer to a technical question, how long does it actually take to get unblocked?
Track this religiously. If your vendor consistently takes a week to respond to critical technical queries, you need to escalate or reconsider the relationship. In enterprise programs, vendor responsiveness often determines the overall timeline more than any other single factor.
Team Turnover and Knowledge Concentration
Measure how many people leave the program each quarter. More importantly, track knowledge concentration how many critical decisions or pieces of technical knowledge are held by single individuals.
If only one person understands how your integration middleware works, you’re one resignation away from serious trouble. If three key technical leads leave in two months, your program is in crisis whether you realize it yet or not.
Good enterprise programs actively measure and manage knowledge distribution. They insist on documentation, pairing, and knowledge transfer as core delivery activities, not optional extras.
Actual Cost vs. Planned Cost (With Scope Normalization)
Every program tracks budget variance. But few do it honestly.
The trick is normalizing for scope changes. If you’re 20% over budget but you’ve also delivered 30% more scope, that’s a different story than being 20% over budget for the original scope.
Track both numbers separately. Real budget variance for original scope tells you about estimation accuracy and execution efficiency. Budget variance including scope changes tells you about scope management and stakeholder discipline.
Most enterprise programs struggle with both.
The Governance Metrics Nobody Wants to Track (But Should)
Some of the most important metrics aren’t technical at all. They’re about organizational behavior and decision-making.
Decision Lag Time: How long does it take your steering committee to make decisions? If you’re waiting four weeks between meetings, and decisions routinely get deferred to the next meeting, you’re adding months to your program timeline.
Stakeholder Alignment Score: Regularly survey your key stakeholders on basic questions. Do they agree on priorities? Do they understand current status? Do they have confidence in delivery? Divergent answers are an early warning signal.
Change Freeze Violations: How often do “emergency” changes break your change freeze before major releases? If this happens regularly, you don’t actually have to change control. You have changed theater.
Architecture Decision Reversals: Count how many times you reverse a significant technical decision. One or two reversals over a multi-year program is normal as you learn. Five or six means you’re not doing proper technical due diligence upfront.
These metrics make people uncomfortable because they shine light on organizational dysfunction. But organizational dysfunction kills more enterprise programs than technical problems ever will.
What Separates Programs That Deliver from Those That Don’t
After watching hundreds of enterprise transformations, certain patterns become clear.
Programs that succeed have executive sponsors who make decisions and protect the team from organizational chaos. Programs that fail have sponsors who show up for steering committees but don’t actually clear blockers or make hard calls.
Programs that succeed have ruthless scope control. They say no constantly. They defer features. They protect the core. Programs that fail try to make everyone happy and end up delivering nothing particularly well.
Programs that succeed treat integration and migration as first-class work streams from day one. Programs that fail treat them as afterthoughts and pay for it later.
Programs that succeed invest in the unglamorous work documentation, knowledge transfer, operational readiness, training. Programs that fail treat these as boxes to check at the end.
Programs that succeed choose delivery partners based on enterprise execution maturity, not just technical capability. They work with partners who understand that enterprise delivery is fundamentally different from product development. Partners who build in time for security reviews, change boards, stakeholder management, and vendor coordination. Partners who’ve learned these lessons the hard way, on previous enterprise programs, so you don’t have to.
This is where working with experienced enterprise partners makes a tangible difference. When Ozrit takes on an enterprise program, the delivery plan reflects real-world enterprise constraints from the start. Not because they’re pessimistic, but because they’re realistic about what enterprise delivery actually involves.
Making Metrics Actually Useful
Collecting metrics is easy. Making them useful is hard.
The metrics that actually drive better outcomes share a few characteristics. They’re reviewed regularly by people who can act on them. They’re tied to specific remediation plans when they go red. They’re simple enough that everyone understands what they mean. And they’re honest no gaming, no creative interpretation, no green-washing problems.
This requires discipline and cultural maturity. It requires leaders who want to know the truth more than they want to hear good news. It requires creating safety for people to report problems early rather than hiding them until they become catastrophes.
In practice, this means your weekly steering committee should spend more time on three metrics that actually indicate program health than on twenty metrics that make you feel busy but don’t drive decisions.
It means when a metric goes red, you stop and address the root cause rather than explaining it away or adjusting the target.
It means you track trends over time rather than obsessing over weekly fluctuations.
And it means you’re willing to slow down or even stop when the metrics tell you you’re heading for trouble, rather than plowing ahead because the timeline is sacred.
The Real Test of Engineering Metrics
Ultimately, engineering metrics in enterprise programs have one purpose: to help you deliver sustainable business value on time and on budget.
If your metrics aren’t helping you do that, they’re vanity numbers. It doesn’t matter how comprehensive your dashboard is or how many data points you collect. What matters is whether you’re catching problems early enough to fix them, making better decisions, and actually delivering working systems that meet business needs.
The best metric of all might be the simplest: six months after go-live, is the business actually using the system as intended? Are they seeing the value that justified the investment? Is the system stable, maintainable, and ready to evolve with changing business needs?
If yes, then whatever metrics got you there were the right ones. If not, then something in your measurement approach missed what really mattered.
Moving Forward
Enterprise program delivery is hard. It’s supposed to be hard. You’re changing complex systems that run critical business operations, coordinating across multiple teams and vendors, navigating organizational politics and technical constraints, and doing it all while the business continues to operate.
The metrics you choose to track say a lot about whether you understand what you’re actually trying to accomplish. Choose metrics that reflect the real challenges of enterprise delivery. Integrate them into honest conversations about progress and risk. Use them to drive better decisions, not to create illusions of control.
And remember that metrics are just tools. They help you see clearly, but they don’t do the work. The work still requires skilled people, experienced partners, clear accountability, and the organizational maturity to deal with truth even when it’s uncomfortable.
The enterprises that get this right don’t necessarily have better technology or bigger budgets. They have better judgment about what to measure, the discipline to act on what they’re seeing, and the humility to acknowledge that enterprise delivery is a craft that demands respect, patience, and hard-won experience.
That’s what actually matters.